PROTEIN ASSAYS
State the objective of your experiment.
To compare the protein concentrations of Talapia fish (Oreochromis) and tongkol fish (mackerel tuna) using the Biuret Protein Assay and Lowry Assay
Describe how you do it.
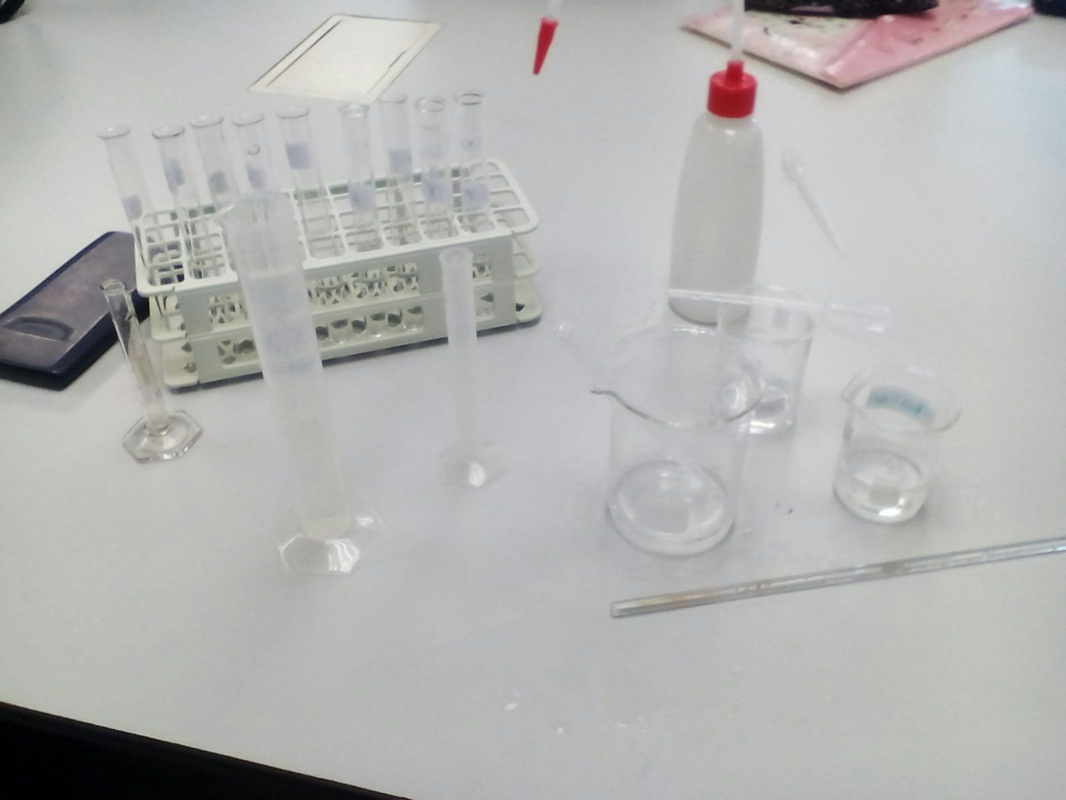
This experiment introduces students to method of determining protein concentrations. The determination of protein concentration is an essential technique in all aspects of protein studies and proteomics. This lab activity is designed to teach students the principles behind a common protein estimation assay known as the Biuret Protein Assay (absorbance at 540nm) and 750 nm for Lowry assays.Weight 20gm of fresh fish and blend into small size with phosphate buffer saline at 200ml. Then incubated it for 24 hours at 4C in 100 rpm shaker. Then filter the sample and centrifuge at 4C at 14000 rpm in 15 minute. The supernatant was collected and filter again using whatman filter no 1. The protein content was measured against gelatine standard using Lowry and Biuret method. Gelatin solutions at 1,2,3,4,5, and 6 mg/ml was prepared for Biuret assay. For Lowry method, the solution of 0.1,0.2,0.3,0.4,0.5, and 0.6 mg/L was prepared.
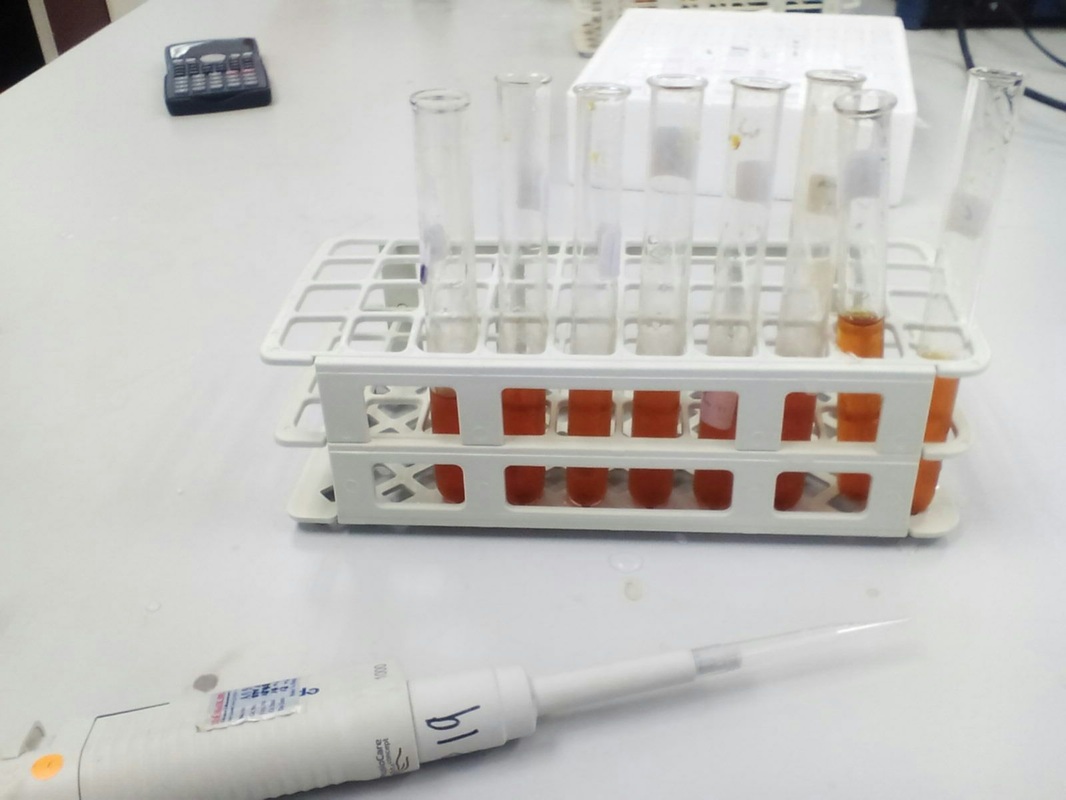
Standard Biuret reagent is already prepared. The 0.50mL of protein is mixed with the prepared Biuret Reagent. The solution is mixed well and allows standing for 10 minute. The absorbance for each tube is read against the blank at 540 nm. For Lowry assay, 2.5 ml of protein were mix with 2.5 ml of lowry reagent 1. After 10 minute add 0.25 ml of Lowry reagent 2 and mix immediately. After 30 minute, the absorbanced was measured at 750 nm.The standard curve is plotted using concentration of standard (mg/mL) against the absorbance at 540 nm for biuret and 750 nm for Lowry. The standard is used to determine the concentration of the protein in the Talapia fish (Oreochromis) and tongkol fish (mackerel tuna).
To analyze the data, a line or curve is fit through the standards. For the sample, read across the graph from the spot on the Y-axis that corresponds to absorbance of the sample until the standard curve is intersected. Read down the graph until intersect the X-axis. The concentration of protein in the sample is the value on the X-axis. To find the equation of standart curve Lowry and Biuret we used the formulae of M1V1= M2V2. We used 6mg/ml gelatine stock. The equation for Biuret test are y = 0.1276 In x + 0.0346 and Lowry are y= 0.0405x - 0.015.
What have you found?
The result of Talapia fish when substitude into the equation of standart curve are 0.8529 mg/ml for Biuret. For lowry test the value are 2.13 mg/L of protein. However in Tuna fish, the value for Biuret are 6.3694 mg/ml protein and the Lowry test are 6.41728 mg/L protein. This show that the marine fish, tongkol have higher concentration of protein then fresh fish, tilapia. Freshwater fish contain higher portions of potassium and phosphorus as well as of the trace mineral iron. Last not least freshwater fish comprise several vitamins. Therefore, freshwater fish can be recommended as wholesome foodstuffs. Freshwater fish are wholesome foodstuffs of high nutritive value. They are a good source for animal protein and especially for essential polyunsaturated fatty acids in human nutrition. Regular eating of fish (freshwater as well as marine fish species) can support preventing cardiovascular diseases.
What have you learned in the session?
From this lab, we have learned how to calculate the concentration of protein in fish.Before this, I just thought that all the fish have same protein concentration. I decided to compare the concentration of protein of fresh water and marine fish. I learned on how to plot the standard curve graft from protein calculation to get a eguation. Actually we do some mistake when we forget to mix the solution with the mixer. Then we need to repeat again this experiment.
Biuret test indicate the presence of peptide bond between the amino group and the carboxyl acid group on adjacent amino acids in a protein. The violet colour is a positive test for the presence of protein. The greater the violet colour intense, the greater the number of peptide bonds that reacts. However biuret test will not detect free amino acids and the characteristic purple colour will not show up if we only have small peptides, since the number of peptide bonds may not be sufficient to yield colour. The Biuret assay is not much good for protein concentrations below about 5 mg/ml. The Lowry assay nearly more sensitive than the Biuret reaction alone.
What would you want to know more from this experiment?
The fish supply the protein need for our body. However, some of studies uses the scale of fish to make a collagen. I think this is the best way to make the environmental product. I would like to know more on what is the type of fish has a good scale to make a best collagen product.
To compare the protein concentrations of Talapia fish (Oreochromis) and tongkol fish (mackerel tuna) using the Biuret Protein Assay and Lowry Assay
Describe how you do it.
This experiment introduces students to method of determining protein concentrations. The determination of protein concentration is an essential technique in all aspects of protein studies and proteomics. This lab activity is designed to teach students the principles behind a common protein estimation assay known as the Biuret Protein Assay (absorbance at 540nm) and 750 nm for Lowry assays.Weight 20gm of fresh fish and blend into small size with phosphate buffer saline at 200ml. Then incubated it for 24 hours at 4C in 100 rpm shaker. Then filter the sample and centrifuge at 4C at 14000 rpm in 15 minute. The supernatant was collected and filter again using whatman filter no 1. The protein content was measured against gelatine standard using Lowry and Biuret method. Gelatin solutions at 1,2,3,4,5, and 6 mg/ml was prepared for Biuret assay. For Lowry method, the solution of 0.1,0.2,0.3,0.4,0.5, and 0.6 mg/L was prepared.
Standard Biuret reagent is already prepared. The 0.50mL of protein is mixed with the prepared Biuret Reagent. The solution is mixed well and allows standing for 10 minute. The absorbance for each tube is read against the blank at 540 nm. For Lowry assay, 2.5 ml of protein were mix with 2.5 ml of lowry reagent 1. After 10 minute add 0.25 ml of Lowry reagent 2 and mix immediately. After 30 minute, the absorbanced was measured at 750 nm.The standard curve is plotted using concentration of standard (mg/mL) against the absorbance at 540 nm for biuret and 750 nm for Lowry. The standard is used to determine the concentration of the protein in the Talapia fish (Oreochromis) and tongkol fish (mackerel tuna).
To analyze the data, a line or curve is fit through the standards. For the sample, read across the graph from the spot on the Y-axis that corresponds to absorbance of the sample until the standard curve is intersected. Read down the graph until intersect the X-axis. The concentration of protein in the sample is the value on the X-axis. To find the equation of standart curve Lowry and Biuret we used the formulae of M1V1= M2V2. We used 6mg/ml gelatine stock. The equation for Biuret test are y = 0.1276 In x + 0.0346 and Lowry are y= 0.0405x - 0.015.
What have you found?
The result of Talapia fish when substitude into the equation of standart curve are 0.8529 mg/ml for Biuret. For lowry test the value are 2.13 mg/L of protein. However in Tuna fish, the value for Biuret are 6.3694 mg/ml protein and the Lowry test are 6.41728 mg/L protein. This show that the marine fish, tongkol have higher concentration of protein then fresh fish, tilapia. Freshwater fish contain higher portions of potassium and phosphorus as well as of the trace mineral iron. Last not least freshwater fish comprise several vitamins. Therefore, freshwater fish can be recommended as wholesome foodstuffs. Freshwater fish are wholesome foodstuffs of high nutritive value. They are a good source for animal protein and especially for essential polyunsaturated fatty acids in human nutrition. Regular eating of fish (freshwater as well as marine fish species) can support preventing cardiovascular diseases.
What have you learned in the session?
From this lab, we have learned how to calculate the concentration of protein in fish.Before this, I just thought that all the fish have same protein concentration. I decided to compare the concentration of protein of fresh water and marine fish. I learned on how to plot the standard curve graft from protein calculation to get a eguation. Actually we do some mistake when we forget to mix the solution with the mixer. Then we need to repeat again this experiment.
Biuret test indicate the presence of peptide bond between the amino group and the carboxyl acid group on adjacent amino acids in a protein. The violet colour is a positive test for the presence of protein. The greater the violet colour intense, the greater the number of peptide bonds that reacts. However biuret test will not detect free amino acids and the characteristic purple colour will not show up if we only have small peptides, since the number of peptide bonds may not be sufficient to yield colour. The Biuret assay is not much good for protein concentrations below about 5 mg/ml. The Lowry assay nearly more sensitive than the Biuret reaction alone.
What would you want to know more from this experiment?
The fish supply the protein need for our body. However, some of studies uses the scale of fish to make a collagen. I think this is the best way to make the environmental product. I would like to know more on what is the type of fish has a good scale to make a best collagen product.
|
|
